Maps
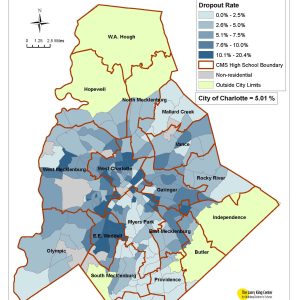
Dropout Rate for Neighborhoods and High School Attendance Zones
The UNC Charlotte Urban Institute created this series of maps, in collaboration with Council for Children’s Rights, in October, 2010, to provide background information and context for principals of Charlotte-Mecklenburg (CMS) high schools and the CMS Investment Group (a group of private donors and community leaders that pledged $55 million to improve graduation rates and […]

New reality: the rise of high-skilled immigrants
When you think of an immigrant, what comes to mind: the person who helped build your house, or the physician discussing your treatment plan? New research indicates that “there are just as many high-skilled as low-skilled working-age immigrants currently living in the United States, and the growth rate of more educated arrivals to the United […]

Gaston, onetime manufacturing heavyweight, now lags Union
Local perceptions may not have caught up with the new reality in the Charlotte region’s manufacturing economy. Even before the recession began in 2007, declines in the textile and furniture industries were changing the structure of local employment. As the downturn continued, counties that depended less on textile and furniture manufacturing lost fewer jobs. The […]

Charlotte region ages around a youthful core
In 1960, the median age for the United States was 29.5 years, meaning that half the population was older than that, and half was younger. In the 2010 Census, the median age for the country moved up to 37.2 years, reflecting what many demographers refer to as the “graying of America”. As with other changing […]
2010 Census Results: Population distribution and change in North Carolina
A summary presentation of population trends related to North Carolina. Based on Census 2010 preliminary (redistricting) data released in the spring of 2011. To see a PDF of the presentation: Download PDF Read the related article on this site.

Census 2010: North Carolina is 6th-fastest growing in U.S.
An examination of the Census 2010 data released so far provides several insights into how North Carolina’s growth compared to other states. North Carolina was the 6th fastest-growing state in the 2000s at 18.5%, putting it just between Texas and Georgia, and virtually tied with Georgia in growth since the 1990s. That level of growth […]

Census 2010: South Carolina Counties in the Charlotte Region
The recently released South Carolina data from US Census 2010 now allow for a more complete picture of growth in the Charlotte Region in the last decade. The South Carolina counties of Chester, Lancaster and York form the southern flank of the 14-county Charlotte Region. The census data show York County was the second-fastest growing […]

Alcoa and the Yadkin River: What’s next?
Last week, the Appellate Court for the District of Columbia ruled against Alcoa’s petition requesting that the Federal Energy Regulatory Commission (FERC) proceed with issuing the company a new license to continue operating its dams along the Yadkin River. This ruling was not the final determination concerning who will own and operate Alcoa’s dams and […]

Census 2010: Mecklenburg patterns of residential segregation
Controversies over school closures in Charlotte and Mecklenburg County over the past year have refocused public attention on issues of race in our community. While the explosive growth of the Hispanic population has been a more recent demographic trend, the issue of residential segregation among blacks and whites has a much longer history in this […]

Census 2010: cities and towns in the Charlotte region
On Wednesday, March 2nd, the first set of data from the 2010 Census was released for North Carolina counties, cities, towns, etc., providing the first hard population counts for these areas since 2000. We know that the Charlotte region as a whole has grown rapidly in the last decade, but how has that growth been […]