Maps
Urban Growth Mapping & Forecasting: 1976-2030, Western NC County Profiles
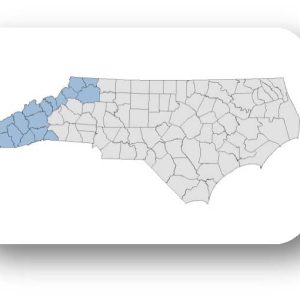
The Renaissance Computing Institute (RENCI) at UNC Charlotte expanded the urban growth mapping and forecasting into 19 counties in the Western part of North Carolina: Alleghany, Ashe, Avery, Buncombe, Cherokee, Clay, Graham, Haywood, Henderson, Jackson, Macon, Madison, Mitchell, Polk, Swain, Transylvania, Watauga, Wilkes, and Yancey Counties. The full research report is available in our web […]