Education

As charters and choice expand, so does segregation
As charter school enrollment has more than doubled across the U.S. over 10 years, demographic data are showing that charter schools are more segregated than traditional public schools. Nationally, 2.5 million students were enrolled in charter schools in 2013 across the U.S. Just 10 years prior, enrollment was less than 1 million.[1] Despite that growth, […]

School choice: Many options but conclusions elusive
Around 80,000 students in Mecklenburg County choose to attend a school other than their neighborhood public school. But what might that mean for the type of education the students are receiving? The answer appears to be, at least for now, “It depends.” School choice generally refers to any student assignment policy that lets parents and […]

Institute study finds positives for McPIE initiative
A higher proportion of middle school students who participated in STEM activities sponsored by a public-private partnership passed eighth- and ninth-grade Common Core math and science exams. Participants also averaged fewer days absent from school in 2013-14 than their counterparts at the school, in the school district and statewide. [highlight] Download a summary of the […]

Report finds strengths, challenges in United Way’s Collective Impact initiative
Research by the UNC Charlotte Urban Institute for United Way of Central Carolinas has found that almost 90 percent of at-risk Charlotte-Mecklenburg Schools students who took part in programs from 14 local United Way-funded agencies over three or more years graduated from high school. The research also found that at-risk students served by UWCC-funded agencies […]

Charter, private, home school or CMS? Is enrollment shifting?
Are more Mecklenburg County parents these days opting for private school over public, or for charters or home schools? With the 2015-16 school year underway, UNC Charlotte Urban Institute researchers looked at how enrollment choices have changed for Mecklenburg families in the past 20 years. The animated graphic below shows how Mecklenburg County public, private, […]

Confessions from the cul-de-sac
Three months ago my family and I moved into our first home. Something about buying a house makes you feel like a bona fide adult, and with that come adult decisions. When my husband and I were deciding where in the city we wanted to live, like many young families we fell into the trap […]
Teacher turnover rate for 2013-2014
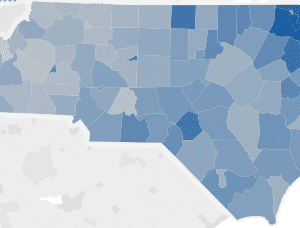
This week’s map illustrates the teacher turnover rate, by school district, for the 2013-14 school year. Teacher turnover is the percentage of teachers who are no longer employed in the district from one year to the next. In 2013-14, 14.1 percent (13,557) of all North Carolina teachers left their school district. In addition to the […]
2013-2014 Annual Measurable Objectives by school
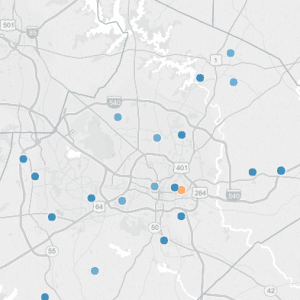
This week’s map takes a closer look at the latest Annual Measurable Objectives (AMOs) at the school level. AMOs are a series of performance targets that state, school districts and schools must meet on designated assessments and indicators for specific subgroups of students annually to meet the requirements of the Elementary and Secondary Education Act […]
Annual measurable targets by district, 2013-2014
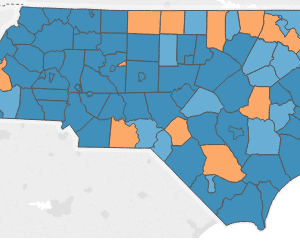
This week’s map looks at the school districts that met annual measurable objectives (AMOs) across the state. AMOs are a series of performance targets that state, school districts and schools must meet on designated assessments and indicators for specific subgroups of students annually to meet the requirements of the Elementary and Secondary Education Act (ESEA) […]