Maps

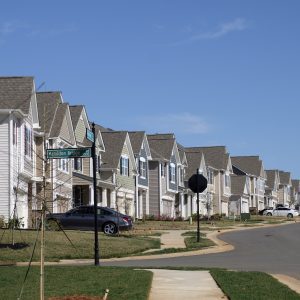
Part 1: How the Blue Line Extension changed Charlotte development
The pandemic has transformed so much about the world, including how we work, where we work, and how we commute. As a result of these shifts, Charlotte area transit use has fallen to less than 50% of pre-pandemic levels. And while debates continue on whether these effects are permanent or temporary, city planners are pushing […]

Mapping displacement risk in Charlotte
As Charlotte grows rapidly, concerns about gentrification and displacement have become key issues for city government to address. Tracking gentrification and displacement can be challenging, as this process of neighborhood change is slow and takes many forms across space and time. However, when analyzed with viable data sources, areas that are potentially vulnerable to gentrification […]
Wall Street-backed landlords now own more than 11,000 single-family homes in Charlotte
For decades, the single-family home rental market was a small-scale industry, made up almost entirely of local landlords who rented out a few houses they bought as investment properties, or perhaps inherited, or held on to after relocating. But the years since the Great Recession have witnessed a dramatic shift, as Wall Street-backed rental companies […]

Updated maps let you explore Charlotte’s changing housing
Which Charlotte neighborhoods have gotten denser, with more residences per acre? Where have average home sizes ballooned? Is the proportion of single-family homes rising or falling in neighborhoods where new apartments and tear-downs vie for space? Newly updated maps on the Charlotte-Mecklenburg Quality of Life Explorer allow you to probe these questions and visualize changes […]

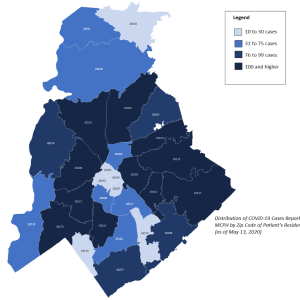
Tracking confirmed coronavirus cases in our region
This map shows the cumulative number of confirmed coronavirus cases per 100,000 residents in the 14-county region the UNC Charlotte Urban Institute serves. The number varies significantly between the counties, which could be a reflection of factors ranging from population density to how many tests have been administered. This map, and the below graphics, will […]

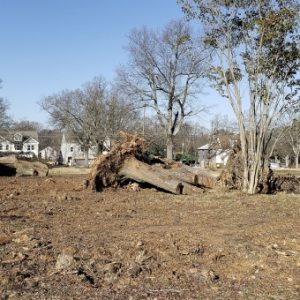
Mapping Charlotte’s lost buildings: Demolitions on the rise again
By Nathan Griffin
Charlotte’s aging buildings are being torn down at an alarming rate, the product of a fast-growing population and strong real estate market.
Some were fine examples of classic architecture, like the long since demolished Masonic Temple on South Tryon, an Egyptian Revival-style building from 1914, or Mecklenburg County’s first main library, built in 1903 with a grant from Andrew Carnegie.
Others were notable for their cultural and historical connection — for instance, the recently demolished library and auditorium at Central Piedmont Community College’s central campus, which provided a community resource for learning and gathering. When these buildings are destroyed, some small part of the character and history of the city is lost with them [ …]
Charlotte’s losing its green canopy, despite efforts to save trees
Charlotte is losing over three football fields a day worth of trees. That’s the sobering conclusion of a study by the University of Vermont in collaboration with TreesCharlotte, detailing how development, age, storms and other factors have cut down Charlotte’s tree canopy. The percentage of Charlotte covered by tree canopy fell from 49% to 45% […]
Coronavirus resources: Data, maps and more
The coronavirus pandemic has generated a flood of data, maps and other resources to track the spread — and places to get help — throughout the region. Many of these resources are scattered across different websites and dashboards. Here’s a brief summary of what’s available, collected in one place. We will update this list as […]

Five maps that show inequality in Charlotte in surprising ways
Charlotte is familiar with the so-called “crescent” and “wedge,” the longstanding pattern of race, income and wealth distribution that shapes much of the city. Wealthier, and often more white, residents are concentrated in the wedge-shaped slice of south Charlotte, while an arc of lower-income communities stretches to the north, east and west. It’s an oft-referenced […]

Turkeys? Pecans? Collards? Mapping your Thanksgiving meal
Although North and South Carolina are urbanizing, with fast-growing cities and suburbs, agriculture remains a major piece of the economy for both states. Agriculture contributes $78 billion to North Carolina’s economy and $42 billion to South Carolina’s. It’s fairly well-known that North Carolina is a major turkey producer (No. 2 in the nation). But what […]