Maps

Mapping ‘Latino’ in the Charlotte region
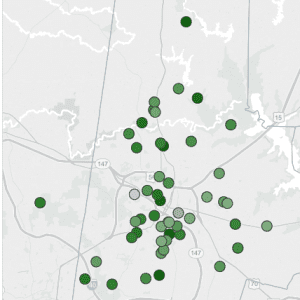
The term “Latino,” like “Hispanic,” covers many different countries and cultures. With the opening last month of the exhibit “¡NUEVOlution!: Latinos and the New South,” at Charlotte’s Levine Museum of the New South, and with National Hispanic Heritage Month taking place in the first part of October, the UNC Charlotte Urban Institute looked at the […]

Mapping the Charlotte region’s international community
Charlotte’s popular Yiasou Greek Festival kicks off this week, the first in a series of international festivals taking place in Hickory and Charlotte and featuring Indian, German and Latino culture, with UNC Charlotte’s 40th annual International Festival on Oct. 17. With the spotlight on those cultural groups, researchers at the UNC Charlotte Urban Institute have […]

Whose N.C. school bus ride lasts longest? Hint: Look west
With students heading back to school Monday, Aug. 24, at most Charlotte-area public school districts, school buses are already rolling as drivers practice their routes. (Nearby S.C. schools mostly opened this week.) School buses constitute the state’s largest public transit system. An estimated 13,400 buses will carry some 800,000 N.C. youngsters to school and back […]
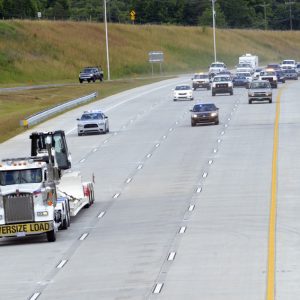
Charlotte’s I-485 lures growth, and with growth comes traffic
With the final leg of I-485 opening in June, motorists cheered the new, unclogged lanes. But if the past is prologue, eventually new development nearby will bring congestion. Across the United States, it’s always the same story with the same ending: a loop highway is built around a growing city. It provides traffic relief for […]
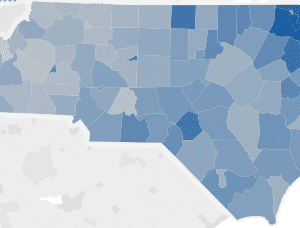
Teacher turnover rate for 2013-2014
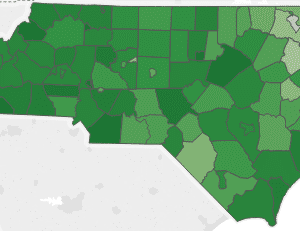
This week’s map illustrates the teacher turnover rate, by school district, for the 2013-14 school year. Teacher turnover is the percentage of teachers who are no longer employed in the district from one year to the next. In 2013-14, 14.1 percent (13,557) of all North Carolina teachers left their school district. In addition to the […]
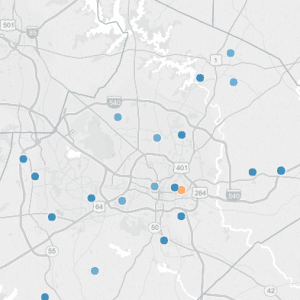
2013-2014 Annual Measurable Objectives by school
This week’s map takes a closer look at the latest Annual Measurable Objectives (AMOs) at the school level. AMOs are a series of performance targets that state, school districts and schools must meet on designated assessments and indicators for specific subgroups of students annually to meet the requirements of the Elementary and Secondary Education Act […]
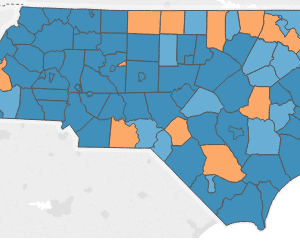
Annual measurable targets by district, 2013-2014
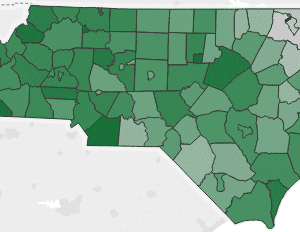
This week’s map looks at the school districts that met annual measurable objectives (AMOs) across the state. AMOs are a series of performance targets that state, school districts and schools must meet on designated assessments and indicators for specific subgroups of students annually to meet the requirements of the Elementary and Secondary Education Act (ESEA) […]
N.C. student proficiency by school, 2013-14
This week’s map takes a closer look at the newest proficiency data at the school level. The table to the right of the map lists proficiency rates in descending order for the subject and grade selected for all schools in the district. You can also view school proficiency rates for specific grades, subjects and student […]
N.C. student grade-level and subject proficiency by district, 2013-14
This week’s maps take a closer look at the newest proficiency data by school district. We have separated the data into two dashboards—one for end-of-grade (EOG) proficiency and one for end-of-course (EOC) proficiency. Each shows proficiency rates of subject and, for the EOGs only, the grade. The table below the map lists the percent proficient […]
Mapping N.C. student overall proficiency by district, 2013-14
This week’s map looks at the newest proficiency data for school districts for end-of-grade (EOG) and end-of-course (EOC) exams. EOG proficiency rates reflect the share of all end-of-grade tests taken (3rd-8th for reading and math, 5th-8th for science) that were scored proficient. EOC proficiency rates are the percent of all end-of-course tests taken (in Math […]