Maps

Explore CMS data at the school level
The UNC Charlotte Urban Institute has partnered with MeckEd to provide a series of interactive maps that allow the public to do their own exploration of CMS schools. Those maps have now been combined into a new interface that creates an integrated school data resource. The maps show data on teacher turnover, student suspension rates, […]

Boundary change boosts Charlotte metro population
In January, the Charlotte metro area population was 1.8 million people. In February, the metro area population was 2.3 million. Where did the half-million people come from? New boundaries were drawn for metropolitan statistical areas. In February 2013, new MSA definitions* took effect. The changes, based on commuting ties among counties, are part of an […]

Charlotte metro: Still high-growth, still strong at core
Of metro areas with more than 1 million people, Charlotte ranked ninth nationally in population growth from 2011 to 2012. That growth was strongest at the center of the metro area, in Mecklenburg County, which outpaced the suburban counties in the region for the second year. Charlotte’s ninth rank in growth came from a list […]

CMS proficiency: Maps and trends
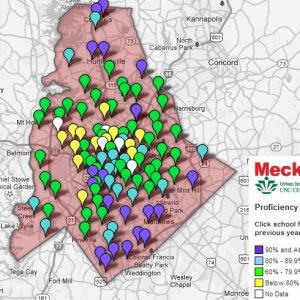
Maps of student scores reveal patterns of high achievement in northern and southern parts of Mecklenburg County and a more complex mix of high and low scoring schools within Charlotte. A closer look reveals that schools with big improvements since last year are scattered around the city. As part of a continuing partnership with MeckEd, […]

Mapping CMS high school data
How well do you understand the differences between high schools in CMS? After years of rapid growth and changing demographics in Mecklenburg County, it may be time to update your perspective. The UNC Charlotte Urban Institute has compiled interactive maps of Charlotte-Mecklenburg high schools as part of our partnership with MeckEd. With this tool, it […]

How to find information on your neighborhood
The new Charlotte-Mecklenburg Quality of Life Dashboard gives information on a variety of neighborhood conditions, providing some of the most extensive neighborhood-level information available in the United States. The report is different this year in several ways: it covers a larger area, has many more data items and all the previous neighborhood zones have changed. […]

Mecklenburg charter schools: Maps, data and more
In the 2011-12 school year, charter school students in Mecklenburg numbered 8,281, or 5.68 percent of the 137,497 students enrolled in Charlotte-Mecklenburg Schools.* Local nonprofit MeckEd has organized information on local charter schools in a way that will help make it easier to understand more about each school and the results each is achieving. Bill […]

How’s drive time? Mapping Meck commutes
Commuting stories – we’ve all got one. Some are worse than others. Mecklenburg commutes are some of the worst in the nation. How does your commute time stack up? The maps below use 2010 U.S. Census data to break down average commute times into five-minute intervals (with the exception of the three highest categories) by […]

How Charlotte area school districts scored on the SAT
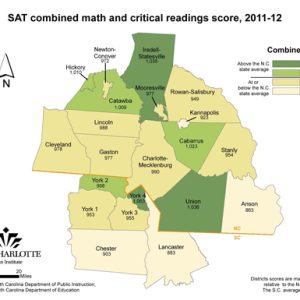
Charlotte-Mecklenburg Schools has an average score just below the N.C. state average for combined math and reading scores as well as the total combined score that includes writing (second map). Schools within CMS ranged widely, from more than 1,700 to less than 1,200 on the total combined scores (math, critical reading and writing). The last […]

Home values in region: Clusters of highs, lows
How much are homes in your neighborhood worth? The era of upside-down mortgages and foreclosures has left homeowners across the country anxious about home values – their own and their neighbors’. In the midst of this housing market upheaval, explosive growth in the Charlotte region has reshaped residential patterns. Clusters of higher-value homes now stretch […]