Maps
By Andrew Bowen, City of Charlotte The Charlotte Mecklenburg Quality of Life Explorer is a tool that provides incredible value to our local governments, especially the City of Charlotte. At its core, it is a single location that provides consistent, reliable, and up-to-date information about the City and its neighborhoods. Whether there is a need […]

By Katie Zager Although we are celebrating the 10th anniversary of the Quality of Life Explorer, the history of Quality of Life in Charlotte actually goes back more than 25 years. Below is a brief timeline of the development of the Quality of Life project in Charlotte. 1993: Charlotte Mecklenburg Planning Commission Identifies City Within […]
Editor’s Note: We’re celebrating 10 years of the Charlotte-Mecklenburg Quality of Life Explorer. By Katie Zager The Charlotte Mecklenburg Quality of Life Explorer launched ten years ago as a collaboration between UNC Charlotte, The City of Charlotte, and Mecklenburg County. The dashboard, which can be found online at mcmap.org/qol is a neighborhood indicators project, showcasing […]

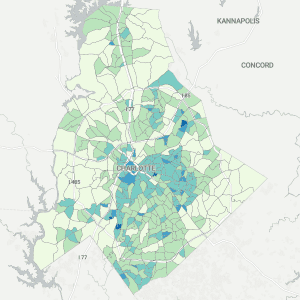
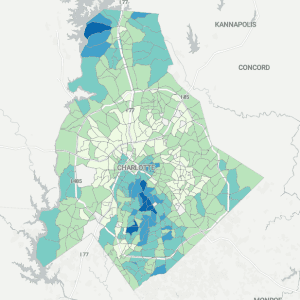
By Ely Portillo What neighborhoods in Charlotte have a high share of renter households, and where are people most likely to own their homes? What parts of the county have the highest concentration of babies with low birth weights? Where can you find two adjacent communities with a nearly three-decade difference in average lifespans? If […]
The Quality of Life Explorer — Charlotte-Mecklenburg’s source for more than 80 interactively mapped variables about the economy, environment, demographics and more — has been updated with new information allowing you to explore our community. Maps that rely on data from the U.S. Census’ American Community Survey are now up-to-date. This includes variables such as […]

When it comes to economic mobility – low-income children’s ability to rise from poverty – we’ve known for a while that where you live influences your chances of success. Now, a new study suggests it’s not just where you live, but who you know that can tip the odds. A vast new project looking at […]

Your access to medicine, lifesaving COVID-19 vaccines and other pharmacy services might depend on what part of town you live in. The Urban Institute recently updated the Quality of Life Explorer data maps to include several new metrics, one of which is particularly relevant as we enter year three of the global pandemic. “Proximity to […]

We often paint Charlotte’s housing market in broad strokes: rising prices, bidding wars and gentrification reshaping neighborhoods. Updated data on the Charlotte/Mecklenburg Quality of Life Explorer lets you can dig deeper into the story told by those aggregate numbers. Charlotte’s neighborhoods are starkly different when it comes to characteristics such as what percentage of homes […]
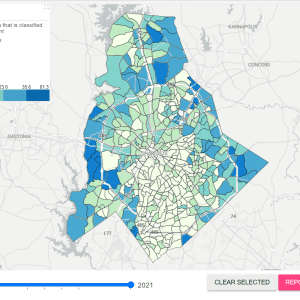
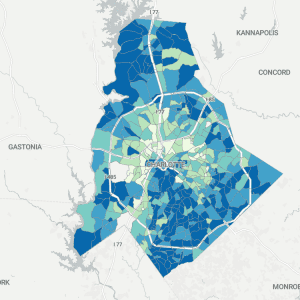
Which parts of Charlotte use the most water? Where is our growth eating up whatever vacant land is left in Mecklenburg County? Where are the racial, economic and other dividing lines that crisscross our community? You can answer these questions and more with the updated Quality of Life Explorer maps published online today. A joint […]

In Part 1 of this series, I showed that there was a sharp increase in development since construction began on the Blue Line Extension in 2013. Since then, there has been nearly $1 billion in new construction and 7,400 new residential units alongside the line. And despite the pandemic, demand for new construction has remained […]

The pandemic has transformed so much about the world, including how we work, where we work, and how we commute. As a result of these shifts, Charlotte area transit use has fallen to less than 50% of pre-pandemic levels. And while debates continue on whether these effects are permanent or temporary, city planners are pushing […]

As Charlotte grows rapidly, concerns about gentrification and displacement have become key issues for city government to address. Tracking gentrification and displacement can be challenging, as this process of neighborhood change is slow and takes many forms across space and time. However, when analyzed with viable data sources, areas that are potentially vulnerable to gentrification […]