African-American

A ‘crisis that’s brewing’: How this program plans to help NC farmers
On weekday mornings, Davon Goodwin drops off his son at elementary school and heads to the Sandhills AGInnovation Center in Ellerbe to see what the day will bring. Some days he plants vegetables or fruit at the center, occasionally with the help of volunteers. When farmers show up needing a tractor, tillers or mobile refrigerated […]
New maps show Charlotte demographic trends
New data on the Quality of Life Explorer mapping tool paint a picture of how demographics are changing across Charlotte and Mecklenburg County, as well as other measures such as bicycle friendliness, voter participation and average water consumption. The Quality of Life Explorer is a joint tool of Mecklenburg County, the city of Charlotte and […]

The Urban Institute Research Faculty Fellows seek to better our region
A new program designed to identify solutions for some of the pressing needs and issues facing the greater Charlotte region is getting underway this fall at the UNC Charlotte Urban Institute. For the first time, the Institute has named a cohort of Faculty Fellows to conduct research projects and work alongside local stakeholders to understand […]
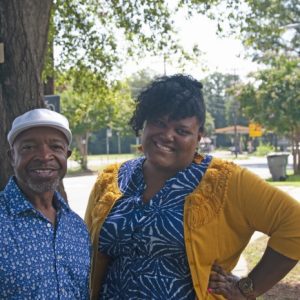
Can a community land trust stop gentrification in west Charlotte? This group thinks so.
With a full-time executive director and a $200,000 grant, a three-year-old west Charlotte nonprofit is accelerating its efforts to stave off displacement with a housing strategy that’s unprecedented in this fast-developing city. In the next five years, the West Side Community Land Trust wants to build 50 permanently affordable housing units in historically black neighborhoods […]

Review: In ‘A Delicious Country,’ an author rediscovers the Carolinas
Author Scott Huler will be interviewed on the “Charlotte Readers” live podcast at 3 p.m. Saturday, July 27, at the Charlotte Museum of History. The event is free and open to the public. More information is available here. Earlier that day, 11 a.m.-2 p.m., the museum will host a free symposium showcasing research by museum […]

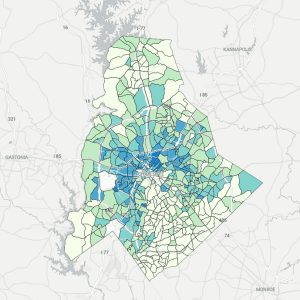
Five maps that show stark health disparities in Mecklenburg County
Sharp differences in race and income are visible on a map of Mecklenburg County, generally in the familiar “crescent and wedge” pattern many Charlotteans are familiar with. For example, check out the divisions on this map of household income: But differences are also available in other, more unexpected dimensions as well. These five maps illustrate […]
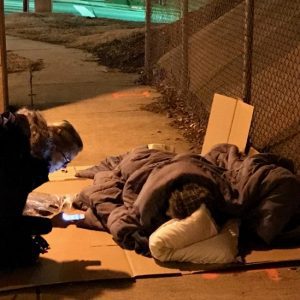
A new local racial equity analysis tool highlights disparities in homelessness
In January 2019, the U.S. Department of Housing & Urban Development (HUD) released a Continuum of Care (CoC) Racial Equity Analysis Tool to help communities across the United States understand who is accessing local CoC systems and what outcomes are being achieved. Mecklenburg County Community Support Services, in partnership with UNC Charlotte Urban Institute, adapted […]

Do youth end up in the justice system because they disengage from school?
Are youth who are disengaged from school more likely to enter the juvenile justice system – and does this vary for youth of different races and ethnicities? That was the question UNC Charlotte professor Dr. Susan McCarter set out to answer. Using data from the Institute for Social Capital, an integrated data system that’s part […]

High school graduation rate demographics by school for 2013-14
This week’s map shows high school graduation rates at the school level and presents the latest numbers for various demographic groups. Choose a district and demographic group from the menu to the right of the map to see the rates for students of a particular race/ethnicity, sex, socio-economic status, English proficiency, or gifted status. Schools […]
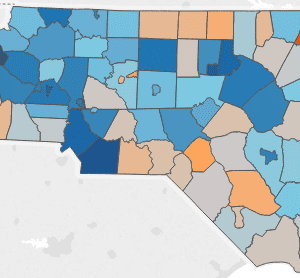
2013-2014 High School Graduation Rate Demographics
This week’s map continues exploring high school graduation rates across the state and presents the latest numbers for various demographic groups. Choose from the menu below the map to see the rates for students of a particular race/ethnicity, sex, socio-economic status, English ability, or gifted status. Districts in blue are above the state average for […]